http://blog.kissmetrics.com/conversions-statistical-confidence/?utm_medium=email&utm_campaign=blog_newsletter&utm_source=pardot&utm_content=blog_post_7_16_14&utm_term=null
If you read conversion optimization case studies regularly (which you should), you’ll often come across an example like this:
The variation with [insert proposed tested idea here] increased downloads by 85% with 97% statistical confidence.
But what does that really mean? And why do conversion fans love throwing that term around so much?
Understanding the Role of Chance
Let’s take a look at that example again – an increase in downloads of 85% with 97% statistical confidence. That means, if we were to look at the test results as pure chance, you’d only see that 85% increase, 3% of the time – an event that anyone would consider extremely rare.
Therefore, we can deduct with 97% certainty that those results are not due to pure, random chance.
Now, most tests aren’t that exact. There are lots of outside factors that can lead the results astray, including normal distribution (is the test split evenly?), random sampling (did we chose the right people for the test?), time, and even technical issues that can skew those numbers.
The Myth of Confidence
There’s a whole school of thought on whether or not statistical confidence should even play a role in conversion testing. It’s a good read, sharing the perspective that confidence alone, even with the numbers to back it up, doesn’t make something right in terms of value, revenue, or any of the other common measurement goalposts.
It’s their assertion that statistical confidence is just conversion optimization chest-pounding; this kind of big agency preening that molds and shapes data until they get a beefy number, like 100%, that they can throw up haphazardly on their portfolio.
At its core, confidence only measures the outcome of a specific pattern. No one knows with absolute certainty that those downloads will increase by 85% — those results aren’t guaranteed, which is why it’s so important to run your own tests and determine your own results.
So Confidence Doesn’t Matter?
I’m not saying that you should ditch the numbers, but rather look at things in the role of context. For example, it’s common to tell people who ask “how do I measure my conversion rate?” to wait until they get a certain amount of traffic to their website.
But even thousands, or tens of thousands of visitors doesn’t always result in a change that you can tie to statistical confidence. Look at this example:
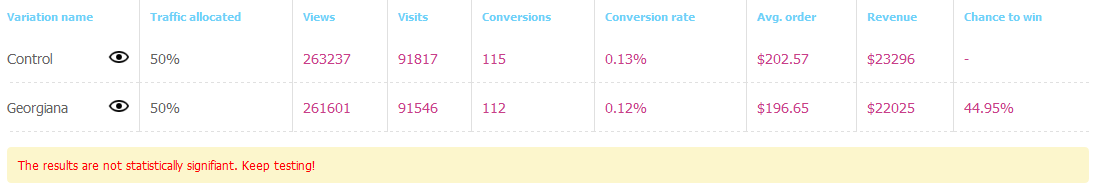
Here we have an example from Marketizator showing nearly 100,000 visits totaling over 250,000 views. That’s an enviable chunk of traffic no matter what your metrics. But looking at the numbers, you can see how close the conversion rate is.
Conversely, you can have far fewer visitors and page views, and yet you’ve reached a statistically significant result.

So traffic doesn’t matter – results do. Now with this in mind, how can you run your tests with greater accuracy?
Plug In All the Data
Wouldn’t it be great if someone made an A/B split testing calculator that you could simply punch the numbers in and get statistically-confident answers? Well, they did, and it’s in both an Excel chart and Google doc for easy use and editing.
The A/B testing significance spreadsheet uses Bayesian statistics. Rather than get too complicated with the numbers, let’s look at a real example.
Let’s say you want to run a split test that determines whether red or green impacts your conversion rate on your call-to-action buttons. It’s a fairly standard test that nearly every company conducts at some point.
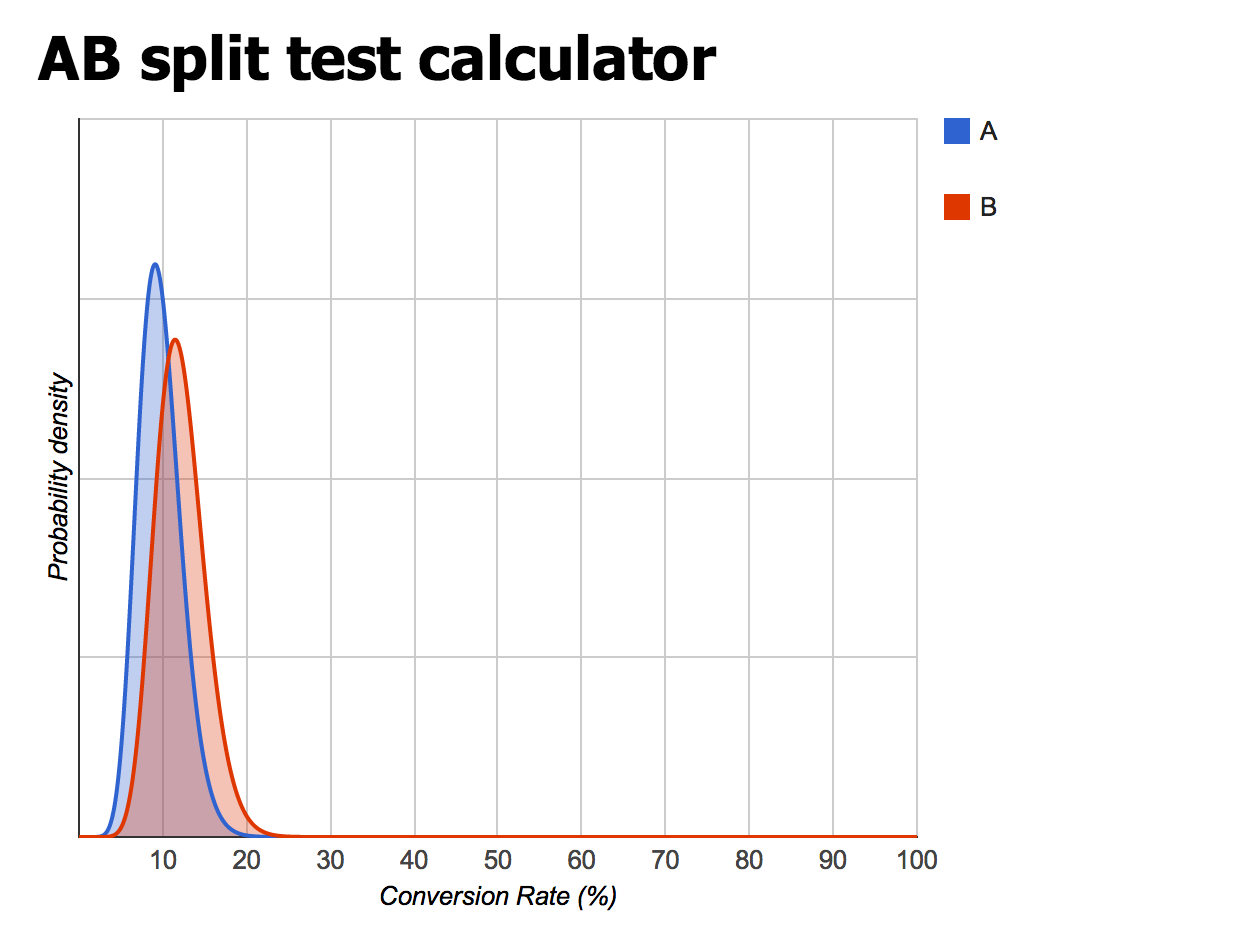
So far, red has converted 12 out of 132 times, and green has converted 14 out of 125 times. By doing simple math in your head, you can already tell that the green button has a slight advantage. But how likely is it that green is really better than red, and those results aren’t just some random fluke? Plugging the numbers into the calculator gets you this:
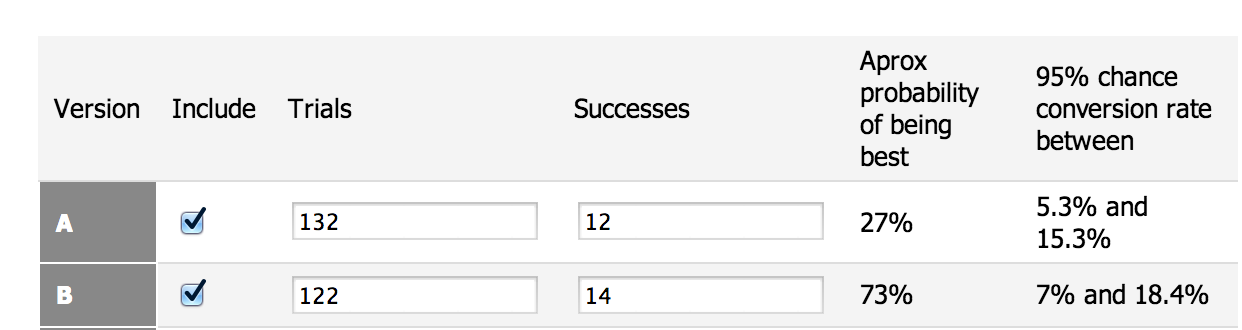
As you’ll see, green has a 73% chance of beating red, complete with the actual estimated conversion rate from making such a change.
Big deal, right? The simple math you did before plugging in the numbers could’ve told you that. But having a split testing calculator like this proves the result – so that you can end the test early, knowing full well that the change will most likely improve conversion rates.
Of course, that’s a simple example, and it’s likely that your tests won’t always give you such a clear result. That’s when it’s a good idea to let the machine crunch the numbers and give you that statistical significance you’re craving.
Can I Apply This to A/A Tests Too?
A lot of conversion enthusiasts and professionals recommend doing A/A tests before A/B tests. While this is a good idea depending on the type of test and the results you want to measure, there’s a critical underlying error that gets made all-too-often, which can radically alter the results of your test.
The Error of Statistical Confidence
What?! I thought we were aiming for statistical confidence in our tests! We are, but what happens many times, is that the test starts out flawed, in that the test runs until the results achieve statistical significance.
How Not to Run an A/B Test illustrates a great example of this, in that, if you don’t cap your sample size beforehand, running a test until it reaches “statistical significance” is like racing two cars along a dusty highway. If one of them runs out of gas, and you keep pushing it, sure, it’s still moving forward, but at the expense of your very tired, achy muscles.
If the mere notion of equations on that page makes your eyes glaze over (as it does mine), there’s a nifty sample size calculator for you to get the numbers of visitors you’ll need to reach that statistical significance. And your math teacher said you wouldn’t always be carrying around a calculator everywhere you go… yay, technology!
The Bottom Line
The fact is, conversion optimization is both an art and a science. There’s no black-or-white answer to what “statistical significance” is that would work for everyone. What matters aren’t the numbers, strictly speaking, but the results. Look at statistical significance as more than just a flashy percentage to throw around, and more as an indicator of concrete certainty – that you’re making the right decisions based on the best possible evidence and testing conditions. Realize that no test will likely ever give you that coveted 100%, and understand that human nature can always throw your tests a curve-ball.
When you take those factors into consideration, you’ll be well-prepared for creating and launching tests that give you both the raw data and the increased revenue you’re aiming for.
Now it’s Your Turn…
How has statistical significance impacted your split tests? How much consideration do you place on it when looking at your data? Share your thoughts and perspective in the comments below!
About the Author: Sherice Jacob helps businesses improve website design andincrease conversions with user-focused design, compelling copywriting and smart analytics. Learn more at iElectrify and get your free conversion checklist and web copy tune-up. Follow @sherice on Twitter, LinkedIn or Google+ for more articles like this!
No comments:
Post a Comment