Booz & Company’s annual study shows that spending more on R&D won’t drive results. The most crucial factors are strategic alignment and a culture that supports innovation.
The elements that make up a truly innovative company are many: a focused innovation strategy, a winning overall business strategy, deep customer insight, great talent, and the right set of capabilities to achieve successful execution. More important than any of the individual elements, however, is the role played by corporate culture — the organization’s self-sustaining patterns of behaving, feeling, thinking, and believing — in tying them all together. Yet according to the results of this year’s Global Innovation 1000 study, only about half of all companies say their corporate culture robustly supports their innovation strategy. Moreover, about the same proportion say their innovation strategy is inadequately aligned with their overall corporate strategy.
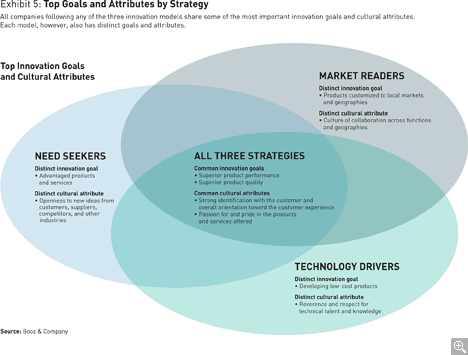
This disconnect, as the saying goes, is both a problem and an opportunity. Our data shows that companies with unsupportive cultures and poor strategic alignment significantly underperform their competitors. Moreover, most executives understand what’s at stake and what matters, even if their companies don’t always seem to get it right. Across the board, for example, respondents identified “superior product performance” and “superior product quality” as their top strategic goals. And they asserted that their two most important cultural attributes were “strong identification with the consumer/customer experience” and a “passion/pride in products.”
These assertions were confirmed by innovation executives we interviewed for the study. Fred Palensky, executive vice president of research and development and chief technology officer (CTO) at innovation leader 3M Company, for example, puts it this way: “Our goal is to include the voice of the customer at the basic research level and throughout the product development cycle, to enable our technical people to actually see how their technologies work in various market conditions.”
If more companies could gain traction in closing both the strategic alignment and culture gaps to better realize these goals and attributes, not only would their financial performance improve, but the data suggests that the potential gains might be large enough to improve the overall growth rate of the global economy.
To that end, we continue to emphasize the key finding that our Global Innovation 1000 study of the world’s biggest spenders on research and development has reaffirmed in each of the past seven years: There is no statistically significant relationship between financial performance and innovation spending, in terms of either total R&D dollars or R&D as a percentage of revenues. Many companies — notably, Apple — consistently underspend their peers on R&D investments while outperforming them on a broad range of measures of corporate success, such as revenue growth, profit growth, margins, and total shareholder return. Meanwhile, entire industries, such as pharmaceuticals, continue to devote relatively large shares of their resources to innovation, yet end up with much less to show for it than they — and their shareholders — might hope for.
Last year, we looked at the innovation capability sets companies put together, how they vary by innovation strategy, and which groups of capabilities can best enable companies to outperform their peers. This year, we took a different vantage point, analyzing the ways that critical organizational systems and cultural attributes support those capability sets that are most likely to promote innovation success. The results suggest that the ways R&D managers and corporate decision makers think about their new products and services — and how they feel about intangibles such as risk, creativity, openness, and collaboration — are critical for success. As part of this year’s study, we surveyed almost 600 innovation leaders in companies around the world, large and small, in every major industry sector. As noted, almost half of the companies reported inadequate strategic alignment and poor cultural support for their innovation strategies. Possibly even more surprising, nearly 20 percent of companies said they didn’t have a well-defined innovation strategy at all.
Understanding these issues is particularly important now that innovation spending is on the rise again. After last year’s 3.5 percent drop in global innovation spending, the first-ever decline shown in the data we have tracked for more than a decade, R&D outlays have recovered. Spending among the Global Innovation 1000 surged 9.3 percent in 2010, thanks in great part to the perception of a worldwide economic recovery. (See “Profiling the Global Innovation 1000,” below.)
The Alignment Gap
Issues of culture have long been of great concern to corporate executives and management theorists alike, whether they apply to companies as a whole or to selected areas such as innovation. The reason is obvious: Culture matters, enormously. Studies have shown again and again that there may be no more critical source of business success or failure than a company’s culture — it trumps strategy and leadership. That isn’t to say that strategy doesn’t matter, but rather that the particular strategy a company employs will succeed only if it is supported by the appropriate cultural attributes. So when we approached the topic of culture in the context of innovation for this year’s study, our primary goals were to determine which cultural attributes were most critical to underpinning the focused capability sets required for each distinct innovation strategy that we have previously identified.
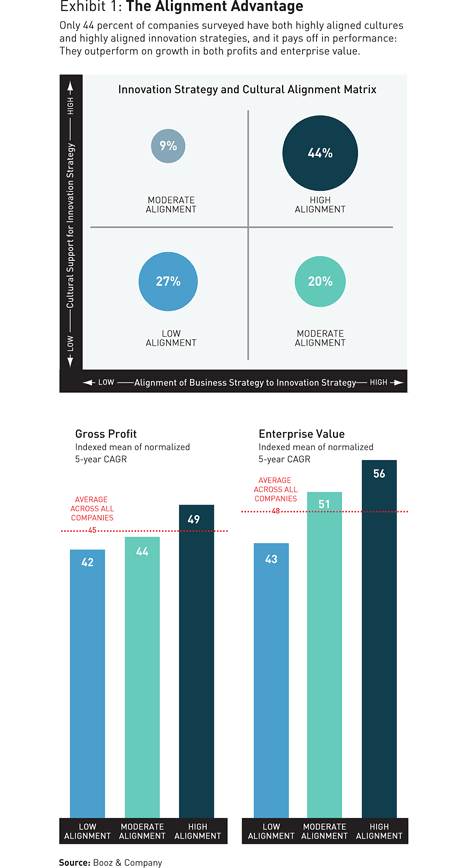
The results are clear — and may explain why many companies have difficulty making their substantial R&D investments pay off. Overall, 36 percent of all respondents to our survey admitted that their innovation strategy is not well aligned to their company’s overall strategy, and 47 percent said their company’s culture does not support their innovation strategy. Not surprisingly, companies saddled with both poor alignment and poor cultural support perform at a much lower level than well-aligned companies. In fact, companies with both highly aligned cultures and highly aligned innovation strategies have 30 percent higher enterprise value growth and 17 percent higher profit growth than companies with low degrees of alignment. (See Exhibit 1.)
On the other hand, companies whose strategic goals are clear, and whose cultures strongly support those goals, possess a huge advantage. 3M is a case in point. Palensky articulates his company’s innovation strategy clearly: “We call it ‘customer-inspired innovation.’ Connect with the customer, find out their articulated and unarticulated needs, and then determine the capability at 3M that can be developed across the company that could solve that customer’s problem in a unique, proprietary, and sustainable way.”
Culture plays a critical role in this strategy, says Palensky. “For over 100 years, 3M has had a culture of interdependence, collaboration, even codependence. Our businesses are all interdependent and collaboratively connected to each other, across geographies, across businesses, and across industries. The key is culture.”
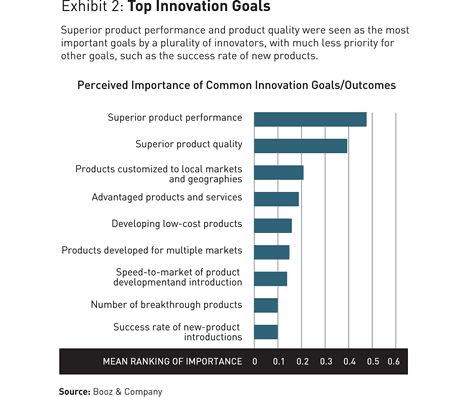
Despite their differences in performance, most companies strongly agree on the strategic goals that matter most in achieving innovation success: “Superior product performance” and “superior product quality” were ranked number one or two by a plurality of more than 40 percent of all respondents. Other goals, such as “developing low-cost products” and “speed-to-market,” were given much lower priority. (See Exhibit 2.)
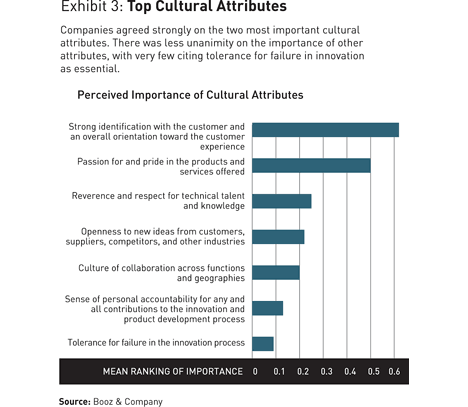
Similarly, companies agree strongly on the cultural attributes that are most prevalent at their companies. More than 60 percent cited “strong identification with the customer” as among the top two, and 50 percent chose “passion for and pride in products.” The lowest ranked was “tolerance for failure in the innovation process.” (See Exhibit 3.) This finding, which contradicts some of the academic research on the subject, raises serious questions about companies’ real appetite for risk taking in their innovation practices.
In general, companies also continue to show a range of significant gaps in how their strategic goals and cultural attributes contribute to performance and support their innovation. Companies that underperform their peers have much to gain if they can close these gaps and achieve much higher degrees of cultural and strategic alignment. We believe the way to do so lies in gaining a greater understanding of the cultural attributes that any given company needs to foster, given its particular innovation strategy. Soma Somasundaram, executive vice president of the Fluid Management segment at the Dover Corporation, describes the challenge this way: “Poor innovation performance is usually not caused by a lack of ideas or lack of aspirations. What some companies lack is the structure needed to effectively dedicate resources to innovation. It’s the lack of will to develop a strategy that can balance today’s need versus tomorrow’s.”
Three Strategies
As in previous years, this year we classified the companies that responded to our survey into the three core innovation strategies via our online Innovation Strategy Profiler. The profiler characterizes a company’s innovation strategy based on its approach to incremental versus breakthrough innovation and the role that end customers play in defining future product needs.
• Need Seekers actively and directly engage both current and potential customers to help shape new products and services based on superior end-user understanding. These companies often address unarticulated needs and then work to be first to market with the resulting new products and services.
• Market Readers closely monitor both their customers and competitors, but they maintain a more cautious approach. They focus largely on creating value through incremental innovations to their products and being “fast followers” in the marketplace.
• Technology Drivers follow the direction suggested by their technological capabilities, leveraging their sustained investments in R&D to drive both breakthrough innovation and incremental change. They often seek to solve the unarticulated needs of their customers through leading-edge new technology.
Just as companies following any of these three strategies can succeed, so any company can manifest strong strategic and cultural alignment, no matter which strategy it follows. A closer look at the survey results, however, does suggest that companies perfecting one strategy — the Need Seekers — are relatively advantaged. They consistently demonstrate better achievement on a number of strategic and cultural variables. Additionally, Need Seekers are more likely to financially outperform their rivals than companies following one of the other two strategies.
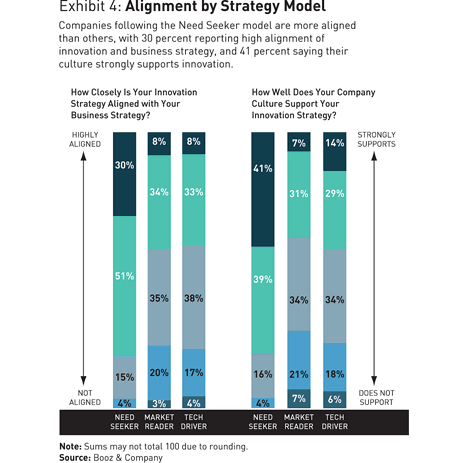
Overall, for example, Need Seekers are more than three times as likely to report that their innovation strategy is strongly aligned with their business strategy as other companies. And Need Seekers perceived their performance in carrying out the two most critical innovation goals — “superior product performance” and “superior product quality” — to be much higher than did companies using either of the other two strategies. As for innovation culture, more than 41 percent of Need Seekers said theirs strongly supported their innovation strategy, compared with just 7 percent of Market Readers and 14 percent of Tech Drivers. (See Exhibit 4.)
These important distinctions were borne out in other ways as well. But the most notable was financial performance. Overall, Need Seekers were 30 percent more likely to report their overall financial performance as being superior to that of their peers than the other two models, and, on average, they appear to have a much better chance of outperforming the competition than either of the other innovation models.
Our previous studies have consistently shown that companies using any one of these strategies can regularly outperform their peers, and that, although top performers had an overlapping set of capabilities critical to success no matter which strategy they followed, those top performers also had developed a unique, focused set of capabilities essential to their strategy. In this year’s study, we viewed those strategic models through a different lens: which strategic goals and cultural attributes led to the greatest success within a given strategy, and how those goals and attributes contributed to the capabilities needed to achieve that success.
Thus, for instance, whereas companies following any of the three strategic models have a common set of strategic goals and cultural attributes, Need Seekers ranked as their highest innovation goal the creation of “advantaged products and services,” and their number one cultural attribute as “openness to ideas from external sources.” These characteristics clearly lead to creating truly differentiated products by leveraging all potential sources of good ideas. Each of the other two models has its own corresponding distinct innovation goals and cultural attributes. (See Exhibit 5.) How do those key goals and attributes aid and abet the efforts of companies in each strategy to develop the capabilities they need to succeed?
Driving Technology
Over the four years since we began our analysis of the three models of innovation, the Technology Drivers strategy has been the most frequently employed around the globe and across industries. And this year it continues to be the most common model among the world’s 10 largest spenders on innovation.
Successful Tech Drivers can no longer depend solely on the ability of their researchers to develop ingenious products that consumers are dying to have. Now, in order to succeed, Tech Drivers must strike the proper balance between the pure R&D efforts that in the past led to high-tech breakthrough innovations, and the more market-oriented activities of their less tech-centered brethren. That’s why the most successful Tech Drivers, like Google, have developed both the capabilities shared by all outperforming innovators, such as the ability to translate consumer and customer needs into product development and engagement with customers, and the capabilities specific to their own strategy: a deep understanding of emerging technologies and trends, and the capacity to manage the life cycle of their products and projects.
Few companies exemplify both the long history of technology innovation and the new, more customer-centric demands better than Hewlett-Packard Company. Famed for its critical role in the founding of Silicon Valley and its long history as a pioneer in a variety of technologies, HP has made a conscious effort to integrate its innovation efforts more tightly with the business, and to ensure that both its strategic goals and the innovation culture that supports those goals are aligned with that overall strategy. And although the company’s overall strategy may change as a result of the recent arrival of Meg Whitman as chief executive officer, the tight link with the innovation culture is likely to continue.
The close alignment of innovation with the business can be seen clearly at HP Labs, the company’s central research organization. Prith Banerjee is HP’s senior vice president of research and director of HP Labs, which has seven locations around the world. In this capacity, he both oversees the company’s researchers and works with its five major business units — each of which has its own R&D unit — to ensure the transfer of ideas and innovations into products and services. “[The] mission of HP Labs,” says Banerjee, “is fourfold. One is to create absolutely breakthrough technologies. The second one is around creating new business opportunities for HP. The third one is to advance the state of the art in whatever we do. And the fourth one is to engage with customers and partners.”
To that end, says Banerjee, “We take a portfolio approach within HP Labs: A third of our research agenda is very basic research looking 10 years into the future. Another third is tied to current products, so it looks maybe six to 18 months into the future. And the remaining third is in the middle — what we call applied research — which looks two to five years into the future and is tied to some applications, but not products.”
That is entirely in keeping with the strategic goals of Tech Drivers: to ensure superior product performance and quality, at the lowest cost possible. And it goes without saying that the entire effort must be imbued with a stronger spirit of respect for technical talent and knowledge, as well as openness to ideas from external sources, including academic researchers from universities around the world. HP Labs makes a concerted effort to involve the company’s customers: It invites more than 500 customers a year in to see what its researchers are working on, and works directly with some customers on “customer co-innovation” projects at the farthest reaches of its research vision.
This structure inevitably causes some tension with the business units — indeed, it’s designed that way. “We are intentionally trying to create trouble for our business units,” says Banerjee. “The businesses are looking in the short term for the next six months, next year. That’s why a third of our activity involves assisting them with their current problems. But two-thirds of our activity is to create disruptive technologies.” Because the business units continue to benefit from the short-term research, and are involved through the lab’s advisory board in developing what Banerjee calls “the wacky, crazy ideas,” they continue to support those ideas as potential breakthroughs.
Reading the Market
The automotive supplier sector, hard hit by the recession and the problems plaguing the auto industry in general, has only recently begun to recover. Among the companies at the center of the upswing is the Visteon Corporation, which produces a variety of systems, including climate electronics, interiors, and lighting solutions, for the world’s leading car manufacturers. Its business depends heavily on working with its customers to determine exactly what they need and then building those products as cost-effectively as possible.
That puts Visteon squarely in the camp of the Market Readers, those companies that carefully monitor markets and listen to their customers in order to gauge what the market is looking for, and then work closely with suppliers and partners to provide it. As Tim Yerdon, Visteon’s global director of innovation and design, says, “Most people think about innovation as just adding technology products. But it’s more than that. What we’re doing is taking a step back, looking at our industry, and asking ourselves, ‘How do we enhance life on board the car?’ A lot of the innovation involved in that is now being done in collaboration both with our supply base and with our customers.”
This approach is in line with the innovation goals we have identified among Market Readers, including customizing products for markets and making sure those products have a clear advantage in the market, in terms of both quality and cost. That, in turn, is supported at top-performing Market Readers by a culture that fosters collaboration across functions and geographies, and openness to external ideas. Together, these goals and cultural elements help sustain the set of capabilities that enable these companies to succeed.
These capabilities include not just a willingness to pay attention to the market and work with customers but also to run a very tight product development ship, using capabilities such as product platform and resource requirement management. Says Yerdon, “In product development, we have a phase-gate process that goes through four different gates to achieve what we feel is an appropriate level of robustness in products and technologies that are developed for sale to a customer. It’s very highly governed and metricized.”
But it is the effort to instill a culture of collaboration that has most transformed Visteon’s innovation efforts. Behind all the company’s innovation efforts — whether they be concept prototypes or new climate control systems — lies a big increase in the amount of collaboration that takes place, across functions, geographies, and joint-venture partners. It used to be, says Yerdon, that groups would work in the same building and never talk to one another. But Visteon teams have been working hard to change that aspect of their culture, in part because collaboration has become a necessary capability now that the various systems that make up cars have become so integrated.
Seeking Needs
As successful as many Market Readers and Technology Drivers are, there is something different about Need Seekers. It has to do with their strategy — working closely with customers to develop products and get them to market first. It has to do with their innovation goals — ensuring that those products have a distinct advantage in the market. And the best Need Seekers have put together a winning set of capabilities, including the judicious use of technology, a disciplined approach to product development, and the ability to generate deep insights directly from regular contact with end-users of their product.
But what really sets the best Need Seekers apart is their ability to execute on their strategy — to combine all these elements into a coherent whole. As we have seen, the innovation strategy that Need Seekers follow is significantly more aligned than either of the other models, on average, and their culture is most likely to support their innovation efforts. Such companies are more profitable and boast higher enterprise value, and a disproportionate number of these highly aligned companies are following the Need Seeker model.
Need Seekers are different in other ways as well. Our study shows that significantly more of the technical leads at companies classified as Need Seekers report directly to the CEO, and that their innovation agendas are much more likely to be developed and clearly communicated from the top down. In the survey, they were nearly twice as likely to point to product development as the function with the most influence in their company’s power structure. And Need Seekers even outperformed in terms of the management of the innovation process: They rated their portfolio management processes highest for both consistency and rigor.
The advantage of the Need Seeker model is evident when the biggest R&D spenders are compared with the most innovative companies. Just two of the top 10 spenders are Need Seekers, whereas six of the 10 most innovative are: Apple, Facebook, 3M, GE, IBM, and Procter & Gamble. (See “The 10 Most Innovative Companies,” below.) Moreover, Silicon Valley companies are often viewed as Technology Drivers, but in fact almost half of the companies we surveyed that hail from the Bay Area are actually Need Seekers. (See “The Silicon Valley Advantage,” below.)
Agilent Technologies Inc. is one of those Silicon Valley Need Seekers. Formed as a spin-off from HP in 1999, the company concentrates on instrumentation and measurement solutions for the communications, electronics, life sciences, and chemical industries. CTO Darlene Solomon puts the distinction this way: “Agilent definitely has the technology focus in our roots, and we want to continue to be a technology leader, not a follower. But to succeed, you need to be balanced in terms of focusing on the customer and understanding the market. There is a lot of great technology we can work on, and no shortage of technical challenges. But we need to choose the areas where, if we make a contribution, the customer and business value that can result is clear.”
The trick for Agilent, as for many other companies, is to balance short-term R&D with long-term thinking about the kinds of things that will need to be measured in five or 10 years. Says Solomon: “It’s really about making sure that we’re at the leading edge of where our customers are going in the near term, and more than 90 percent of that work takes place in the businesses. In Agilent’s research laboratories, we have to make sure that we are placing the right bets now so that we have the right technologies in the future, at the right time, when they’re needed.”
This is a balancing act at which Agilent excels. It is evident in how the company gathers insights from customers and outside innovators alike. Researchers at the lab reach out regularly not just to academics, but also to customers like government labs, to help acquire a better understanding of the future of technology and its customers’ needs. Meanwhile, capturing insights on what customers need now is the responsibility of not just business unit researchers but all customer-facing employees.
When asked what holds all this activity together, Solomon turns the discussion to culture. “There’s a very strong innovation culture throughout the company, and a culture of teamwork. Agilent really encourages that. Innovation is not just R&D in Agilent,” she says. “We’ve really tried to make clear that it’s about everybody questioning the status quo and looking to do something better than what’s been done before. Each year, we recognize and reward innovation through the Agilent Innovates program, with innovation categories ranging from customer satisfaction to employee- and market-centered contributions.”
In many ways, Agilent’s innovation culture stems from its history as part of HP, but Solomon notes that the company has defined its own values. Now, she says, “the cultural areas we’ve really tried to strengthen are speed to opportunity, customer focus, and accountability. Innovation itself has always been a strength; but to really address customer needs more swiftly and to focus on the things that matter most are where the culture of this company is today.”
The Cultural Imperative
Although their innovation strategies, and their relative performance, may differ, companies like Agilent, HP, and Visteon understand what it takes to excel at developing new products that will succeed in the market: an innovation strategy that’s tightly aligned with their overall strategy, a prioritized set of capabilities that match the strategy, and a supportive culture. Our analysis shows that a well-executed Need Seeker model, although it may be the hardest model to create, is also the most likely to deliver superior differentiation, profitability, and growth in enterprise value. That’s because it is the model most able to get to market first with products that address unarticulated customer needs through superior customer understanding, and the most likely to have the cultural attributes and cross-organizational alignment that can sustain its success.
Yet even the most successful companies concede the difficulty of maintaining the cultures that led to their success. Palensky of 3M, certainly one of the most consistently innovative companies ever to exist, describes the challenge: “That’s the thing about cultures — they’re built up a brick at a time, a point at a time, over decades. You need consistency; you need persistence; and you need gentle, behind-the-scenes encouragement in addition to top-down support. And you can lose it very quickly.”
The larger lesson for companies that struggle to convert their R&D expenditures into successful products, solid financial returns, and unassailable market positions is that it may not just be traditional factors like the innovation pipeline that need rethinking. Instead, companies should follow the lead of the most successful innovators in ensuring that the company’s culture not only supports innovation, but actually accelerates its execution. First, make sure that the innovation strategy is clearly articulated, and communicated throughout the organization from the top all the way down to the lab bench. Second, align the technical community with top management, and give the technical leaders a real seat at the executive table. Third, ensure that the innovation agenda translates into a tangible action plan, clearly linked to a short, focused list of capabilities that will allow you to stand out in the marketplace. The tighter the connections between strategy, culture, and innovation, the more leverage your company will bring to bear in converting innovation spending into marketplace results and superior long-term financial performance.
PROFILING THE GLOBAL INNOVATION 1000
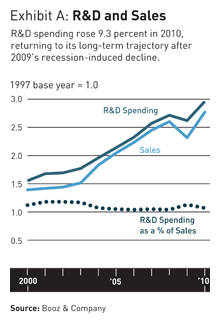
Worldwide R&D spending among the Global Innovation 1000 rose at an annual rate of 9.3 percent to US$550 billion in 2010, rebounding strongly from its recession-induced decline in 2009 — which had been the first fall in the more than 10 years of data we have studied. This year’s total spending was also 5.6 percent above the pre-recession total of $521 billion in 2008, marking a return to the long-term growth trajectory for innovation spending. (See Exhibit A.)
The 2010 increase in R&D spending was less than the Global Innovation 1000’s 15 percent increase in corporate revenues, but this difference was logical, given that most companies had not cut innovation spending in 2009 to the same extent that they suffered decreases in revenues and cut other expense areas that year. Thus, the increase in R&D spending in 2010, especially in certain industries and among larger companies, confirms these companies’ continued willingness to invest in new and improved products and services to respond to ever more competitive markets around the world. Fully 68 percent of companies increased spending in 2010, compared with just 41 percent in 2009.
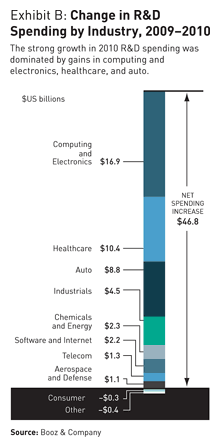
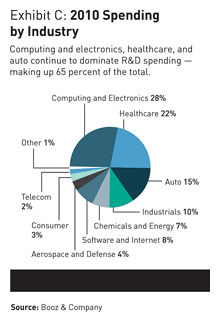
R&D spending grew in all nine sectors we track, but the computing and electronics, healthcare, and automotive sectors contributed the vast majority of the increase — 77 percent, or $36.1 billion — of the total increase of $46.8 billion. (See Exhibit B.) The biggest absolute increase in R&D spending was in the computing and electronics sector, which remained the top spender among all industries, making up 28 percent of the total. With 2010 revenues up 14.2 percent, the industry increased spending on innovation by 6.1 percent — to $16.9 billion. For the first time in the years we have studied, however, no high-technology company was among the world’s top three spenders on R&D.
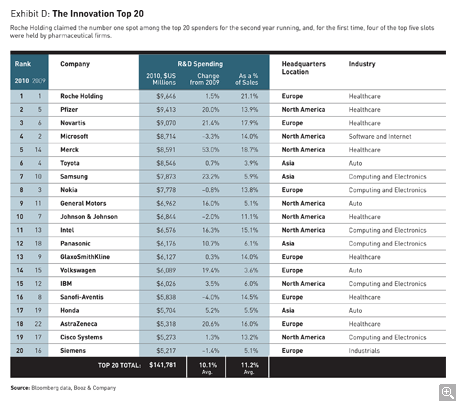
In healthcare, R&D expenditures increased $10.4 billion, or 9 percent. This was the fastest rate among the top three industries in 2010, in line with its 9 percent increase in revenues. That kept healthcare in second place among all industries in terms of its share of total R&D spending, at 22 percent. (See Exhibit C.) And thanks to that high growth rate, healthcare companies — primarily pharmaceutical firms — captured four of the top five spots on the overall list of the Global Innovation 1000, and eight out of the top 20. (See Exhibit D.) For the second year in a row, Roche Holding Ltd. headed the list, spending $9.6 billion of its $45.7 billion in 2010 revenues on innovation. That works out to an R&D intensity rate of more than 21 percent, 11 percentage points above the industry average. Automotive companies were also absent from the top-spender slots: Toyota, which had been number one in R&D spending for several years before the recession, fell to sixth place in 2010, having increased its spending less than 1 percent in 2010, after cutting it almost 20 percent in 2009. Overall, however, the auto sector boosted spending by $8.8 billion, or 8 percent, in 2010, after having cut R&D outlays by 14 percent in 2009. That kept it in third place among all industries in terms of total R&D spending. Revenues for the automotive sector in 2010 were up 16.5 percent over 2009.
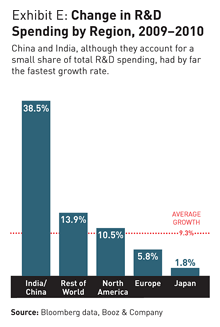
The geographical distribution of innovation spending tells an equally varied story. Every region increased R&D spending in 2010, a significant turnaround from the previous year, when the three regions that make up the lion’s share of innovators — North America, Europe, and Japan — all cut back. The turnaround was cautious in both Europe and Japan, which increased spending at rates significantly below the average of 9.3 percent. North American companies, however, which had cut R&D spending by almost 4 percent in 2009, increased their spending in 2010 by more than 10 percent.
Innovation spending by companies headquartered in China and India — and to a lesser extent those in the rest of the world — continued to boom, albeit from a small base. After having increased spending more than 40 percent the year before, Indian and Chinese companies almost matched that rate again in 2010, upping their investments in R&D more than 38 percent. And companies from other regions around the world increased their spending almost 14 percent. (See Exhibit E.)
The downturn in innovation spending in 2009 was a clear indication of just how difficult the economic environment had been for many companies; it was both surprising and encouraging that R&D spending fell as little as it did. Similarly, the healthy increase in 2010 shows just how determined companies are to keep competing for market share. If there is a note of caution in this year’s data, it is an entirely justifiable one, given the all-too-gradual pace of recovery in some regional markets and general uncertainty about the global economy, which calls into question whether this pace of R&D investment growth will continue in 2011.
— B.J., J.L., and R.H.
THE 10 MOST INNOVATIVE COMPANIES
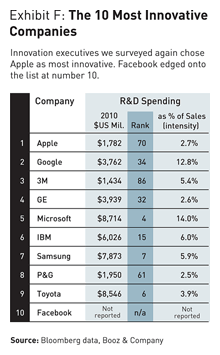
This year, we again asked our survey respondents to choose the companies they thought were the most innovative. And again, Apple Inc. came out on top. Seventy percent of respondents named it one of the three most innovative companies, and more than half voted it number one — no surprise, given the company’s strong performance this year. The iPad continues to define the market for tablet computers, and Apple has been vying with the Exxon Mobil Corporation as most valuable company in the U.S. by market capitalization — a testament to the innovative vision of the late Chairman and CEO Steve Jobs.
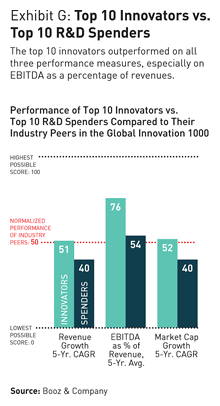
Following Apple, again, were Google and 3M, with 44 percent and 19 percent of respondents including them among the top three, respectively. (See Exhibit F.) This year, Facebook entered the list for the first time, suggesting the growing power of social media as a rich source of innovation on the Internet. (Because Facebook is still private, however, reliable financial data is not available.) Altogether, the 10 most innovative companies boasted significantly better financial results over the past five years than did the top 10 spenders on R&D, especially when results are considered in terms of earnings as a percentage of revenues. (See Exhibit G.)
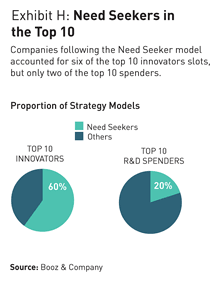
This year, we also looked at the innovation strategies followed by the top innovators. The results are striking, especially in comparison with the results of the top spenders. The four most innovative companies, and six of the top 10, all follow the Need Seeker strategy (and Apple is the classic example). In comparison, only two of the top 10 spenders are Need Seekers. (See Exhibit H.) We rather expected these results, given our findings that companies pursuing a Need Seeker strategy have a greater likelihood of success, thanks to their advantage at assembling the optimal set of capabilities and creating the culture needed to achieve superior performance.
It is also worth noting that although six of the top 10 spenders are pharmaceutical companies, not a single pharmaceutical company was voted onto the list of the most innovative. Indeed, only three companies appear on both top 10 lists: Microsoft, Toyota, and Samsung. Overall, the results show, as we have been saying for years now, that success in innovation isn’t about how much you spend, but rather how you spend it.
— B.J., J.L., and R.H.
THE SILICON VALLEY ADVANTAGE
by Barry Jaruzelski and Matthew Le Merle
Silicon Valley is famous for its long history of leadership in computing, semiconductors, software, biotech, and other innovation-based industries. But beyond its talent base and access to capital, what makes Silicon Valley unique? What exactly is the celebrated “West Coast culture of innovation”? In conjunction with this year’s Global Innovation 1000, we worked with the Bay Area Council, a pro-business consortium of more than 275 companies in the San Francisco Bay area, to identify the strategic, cultural, and organizational attributes that have led to the sustained success of this region. That included segmenting the survey results we received from Silicon Valley companies in hopes of better understanding what cultural and organizational elements make them different.
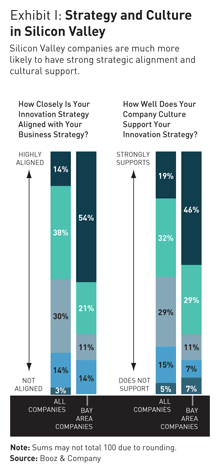
Silicon Valley companies do indeed stand out. We determined that they are almost twice as likely to follow a Need Seeker innovation model, compared to the general population of companies in our global survey — 46 percent versus 28 percent — whereas the proportion of Tech Drivers is almost exactly the same as in the overall population. And they are almost three times as likely to say their innovation strategies are tightly aligned with their overall corporate business strategies — 54 percent, compared with just 14 percent among all companies. When asked whether their corporate cultures supported their strategies, 46 percent of Silicon Valley companies strongly agreed that they did, compared with only 19 percent of all companies, more than double the general population. (See Exhibit I.)
It may come as something of a surprise that Silicon Valley companies are no more likely to follow a Technology Driver innovation model than other companies are. But that, in our view, only strengthens our argument: Like many other top innovators, Silicon Valley companies not only have found success in creating pathbreaking new technologies, but are almost twice as likely as average companies to have developed capabilities that provide a superior understanding of the stated and unstated needs of their end customers. It isn’t just about how many transistors you can fit on a chip, but also about how such advances can lead to products and services that gain unprecedented traction in the marketplace through superior insight into customers, as well as the development of practical value propositions that will win those customers’ business.
- Matthew Le Merle is a partner with Booz & Company based in San Francisco. He works with leading technology, media, and consumer companies, focusing on strategy, corporate development, marketing and sales, organization, operations, and innovation.
BOOZ & COMPANY GLOBAL INNOVATION 1000: METHODOLOGY
As has been the case in the past six editions of the Global Innovation 1000, this year Booz & Company identified the 1,000 public companies around the world that spent the most on research and development in 2010. To be included, a company’s data on its R&D spending had to be public; all data is based on the most recent fiscal year, as of June 30, 2011. Subsidiaries that were more than 50 percent owned by a single corporate parent were excluded if their financial results were included in the parent company’s reporting.
For each of the top 1,000 companies, we obtained the key financial metrics for 2001 through 2010, including sales, gross profit, operating profit, net profit, historical R&D expenditures, and market capitalization. All sales in foreign currencies and R&D expenditure figures prior to 2010 were translated into U.S. dollars according to the average exchange rate in 2010. In addition, figures for total shareholder return were gathered and adjusted to reflect each company’s total shareholder return in its local market. All companies were coded into one of nine industry sectors (or “other”) according to Bloomberg’s industry designations, and into one of five regional designations, as determined by their reported headquarters locations.
To enable meaningful comparisons within industries, we indexed the R&D spending levels and financial performance metrics of each company against the median values in its industry. Global expenditures on research and development were estimated using data from the World Bank, the Organisation for Economic Co-operation and Development, the International Monetary Fund, and government research reports.
To understand how innovation strategy, culture, and organization affect performance, we conducted a Web-based survey of nearly 600 senior managers and R&D professionals from more than 400 companies around the globe. The companies participating represented more than US$182 billion in R&D spending, or one-third of the Global Innovation 1000’s total R&D spending for 2010, all nine of the industry sectors, and all five geographic regions.
Each company was classified into one of our three innovation strategy models — Need Seeker, Market Reader, or Technology Driver — based on survey respondents’ answers to four profiling questions. We then asked respondents to rank their company’s most important innovation goals, cultural attributes, and organizational factors, as well as their perception of their company’s performance on each. We analyzed their responses using a variety of statistical methods that allowed us to distinguish the cultural and organizational attributes most prevalent among companies, depending on which of the three innovation strategy models they followed. Company names and responses were kept confidential (unless permission to use them was explicitly granted), but respondents were asked to identify themselves to allow the association of survey answers with financial metrics. We then conducted interviews with a subset of respondents, in order to gain a deeper understanding of the links among strategy, culture, and organization.
Reprint No. 11404
AUTHOR PROFILES:
- Barry Jaruzelski is a partner with Booz & Company in Florham Park, N.J., and is the global leader of the firm’s innovation practice and its engineered products and services business. He works with high-tech and industrial clients on corporate and product strategy, product development efficiency and effectiveness, and the transformation of core innovation processes.
- John Loehr is a Booz & Company partner based in the firm’s Chicago office. He specializes in helping automotive, industrial, and aerospace companies reach a position of product and market leadership through a combination of product strategy and functional restructuring.
- Richard Holman is a principal with Booz & Company based in Florham Park, N.J. He is a leader of the firm’s innovation practice, specializing in fields with highly engineered products, such as aerospace, industrial, and high tech.
- Also contributing to this article were s+b contributing editor Edward H. Baker and Booz & Company senior associate Marc Johnson.

